agent-based-modeling
Repository for Data 441
Project maintained by dsun1001 Hosted on GitHub Pages — Theme by mattgraham
Project 2
1. Provide a written description of your selected household survey including the number of household and person observations as well as the variables in your source data.
The data for Gabon came from the 2000 DHS survey, completed by Direction Générale de la Stat. des Etudes Economiques. The data for the households has 6203 observations, with 1172 columns of data. Some of the data I used were:
- weights
- size
- gender (hv104)
- age (hv105)
- education (hv106)
Each row of data represents one household, and each row also contained the data about gender, age, and education for each member of the household. The individual data was denoted after the column name for the data category. For example, the age of the first member of a household would be in a column named “hv105_01”, and the second member in a column named “hv105_02”. Each row holds up to 48 members of the same household.
Provide a written description of your spatially located households at the adm0 level of your selected location, including how you located each household, generated the household structure including demographic attributes of persons, and the percent error calculated. If you faced computational issues at the adm0 level when attempting to pivot from households to persons, describe those limitations.
In order to locate each household, the raw household data from DHS was given locations using the rpoint function with the real adm0 population as a way to distribute the households according to the real population density. Then, the survey data was randomly sampled so that it would reflect the population of Gabon. The error of this method was calculated by comparing the number of observations in our sample to the sum of the weights, and this error was calculated to be 0.1857%.
I faced serious computational issues at the adm0 level when attempting to pivot from households to individual persons. The general approach was to pivot gender, age, and education individually first, and then merge them together into one dataframe. The individual pivots were not computationally expensive with about 30,000 observations each. However, merging the dataframes together ultimately took too much memory for my personal computer. I initially tried to circumvent this by using data.tables instead, but again the end result was that the data was too large to work with. I changed my approach by cutting as much redundant data as I could from my dataframes, and was able to pivot to 33,266 individuals.
Provide a written description of your spatially located households at the adm1 or adm2 level of your selected location, again including how you located each household, generated the household structure including demographic attributes of persons, and the percent error calculated. Further analyze your synthetically generated households and persons with regard to percent error. Do you think this population is more or less accurate than the one generated at the adm0 level? What could you have done to improve your measures of accuracy?
Locating the households at the adm2 level for Bendjé mostly followed the same process as for Gabon as a whole. This time, the error was calculated to be 0.2019%. The following is a planar point pattern (PPP) generated for Bendjé.
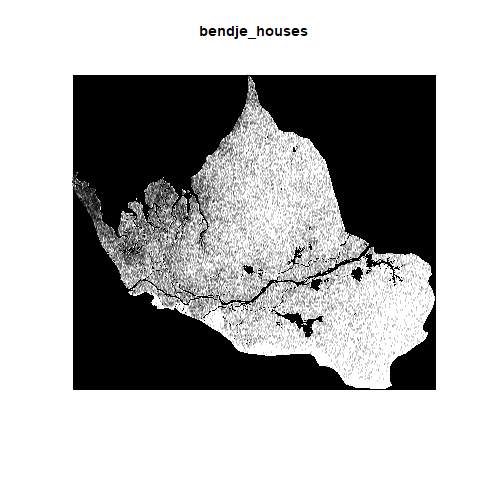
And also a confirmation of the projection below.
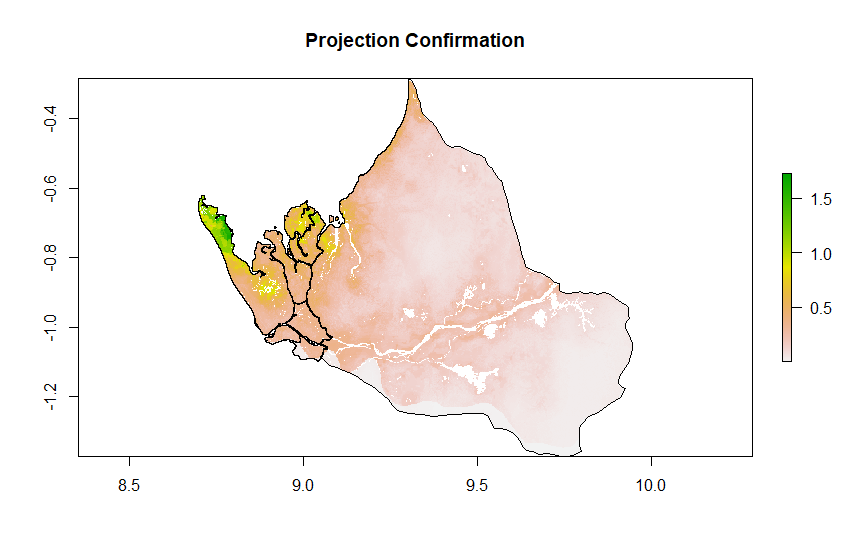
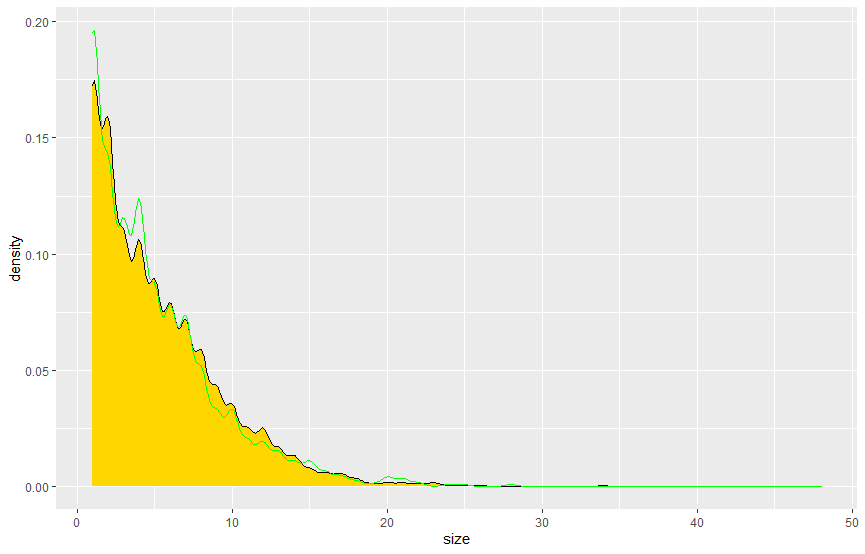
The overall accuracy of the synthetically generated population is about the same level of accuracy for both adm0 and adm2 level, and looking at the distribution of size of households for Gabon compared to Bendjé shows that they are pretty similar. There are slight variations, and I think to increase the accuracy I could increase the sample size in the future.
When compared to a randomly generated synthetic population that describes the demographic attributes of households and persons, does yours more closely approximate reality? How is yours an improvement over a synthetic population that was generated in accordance with complete spatial randomness? Generate plots and incorporate results from your work as evidence in support of an argument that the synthetic population you generated is a good approximation of the reality that existed in your selected location at that given time.
Compared to an entirely random synthetic population, mine more closely approximates reality. Even just using the real population distribution as a function for how to give synthetic household locations will make an enormous difference. The household size distribution also closely resembles the real world data.
I also created heatmaps showing the correlation between size of household, age, gender, and education for the household data. One heatmap is created from raw data, and the other percentizes the data. From the charts, we can see that the percentized has more potential to make predictions.

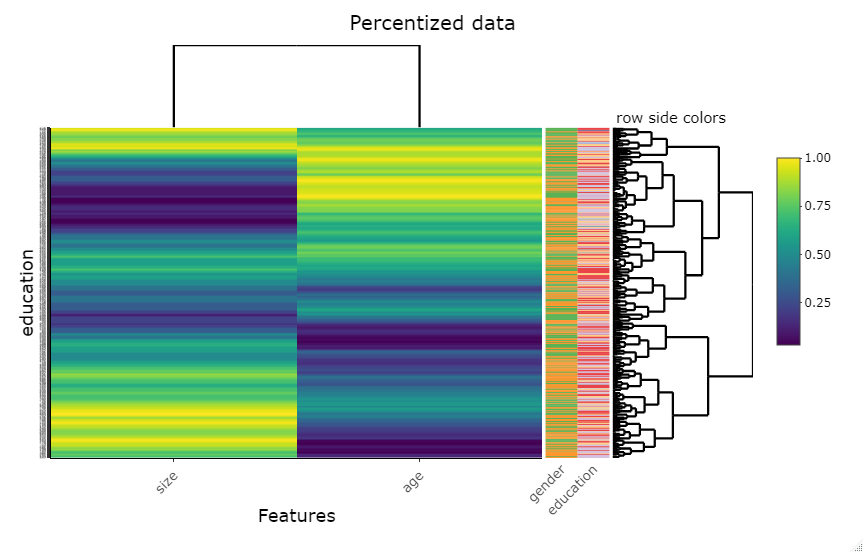
In order to make predictions about education levels, the data was split 60/40 into training and test data sets. A multinomial regression model and ranger implementation of random forest were trained on the training data.
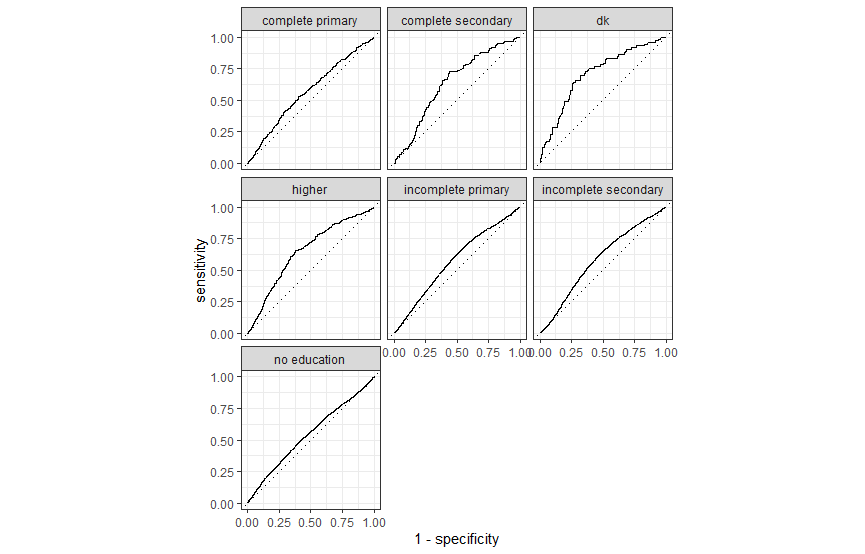
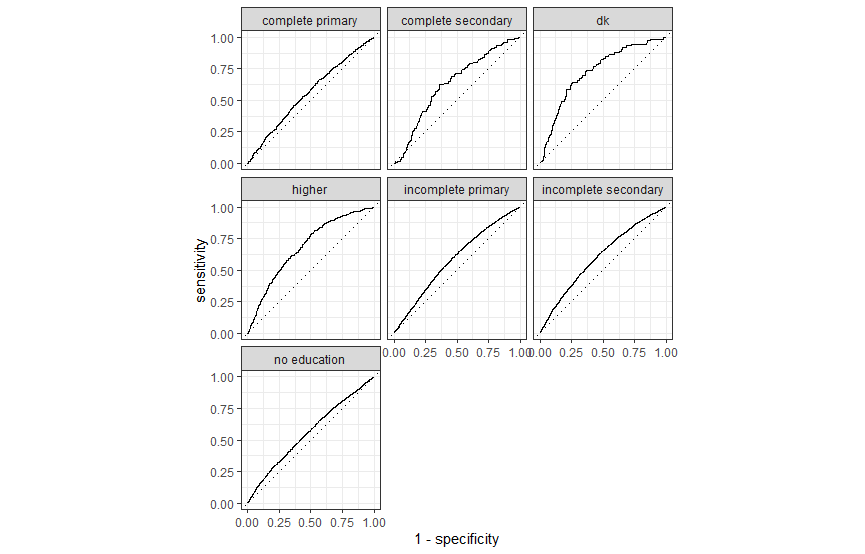
Comparing the ROC of the multinomial regression and ranger models respectively, we can see that they both had similar results. Looking at the area under the curve (AUC) of both graphs, none of them are very high which indicates that there is not a high degree of separability. Both models are slightly better than flipping a coin in distinguishing between classes, and the models are about equal in their ability to predict the classes.
